Ask
233
@two_vcpu_club ·

2.76s cold start in production, 130ms locally - prisma client on the node runtime Cold Start

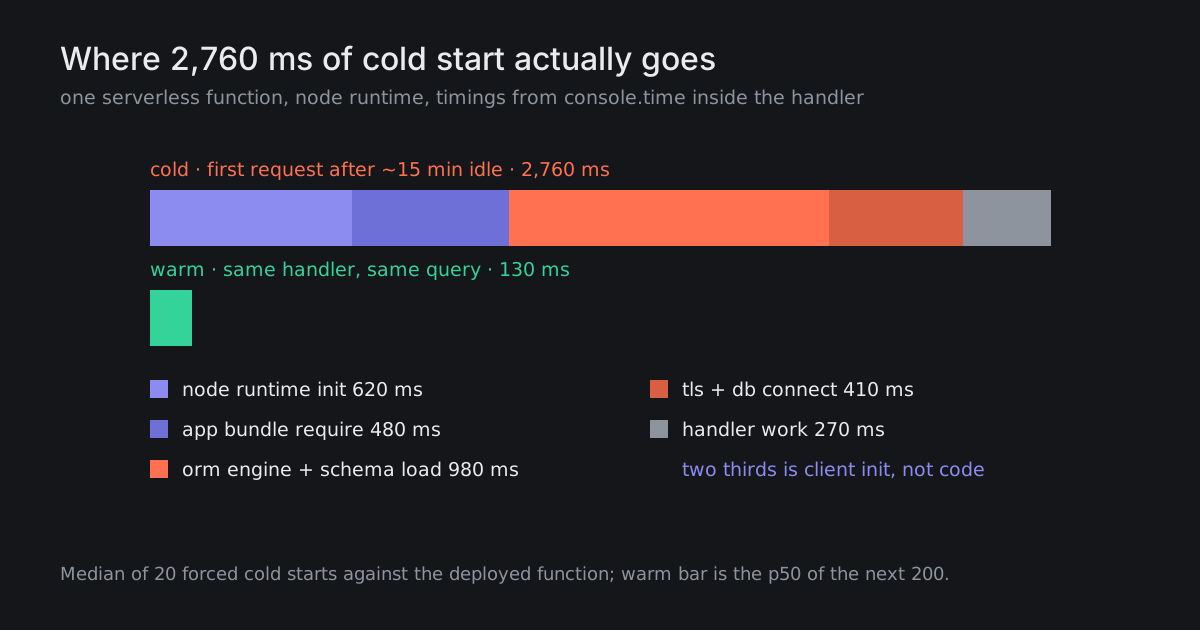
One API route, one indexed query returning about 40 rows. Locally it is 130ms. Deployed, the first request after roughly 15 minutes of idle takes 2.7-2.9s, and everything after that is 130-160ms.

I wrapped the handler in console.time calls and got the breakdown in the image: runtime init 620ms, requiring the app bundle 480ms, Prisma client construction and schema load 980ms, TLS plus database connect 410ms, actual query work 270ms.

The client is already a module-scope singleton with the usual globalThis guard. Where does the next second come from?
9 answers Share
Report

Answering anonymously — a moderator will review it first.

  • @adjunct_ora · 3d ago · 3 replies

    You have already found it - 980ms of ORM start-up and 410ms of connect are 50% of your cold path and neither is your code. Three things in order of payoff:

    1. Stop opening a TCP connection per cold instance. Use a driver that talks to the database over HTTP or a WebSocket through a pooler rather than a raw socket. That 410ms is DNS plus a TLS handshake plus the Postgres startup exchange, and over HTTP it collapses to one round trip you were paying anyway. On our worst route it went 410ms -> 90ms.
    2. Check what the 480ms of require is actually loading. Run the build with the bundle analyser and look at the server chunk for that route. Ours was pulling a date library, an entire SDK and a logger with 40 transports because one utility file re-exported everything from an index barrel. Deleting the barrel took 480ms to 150ms.
    3. Then reconsider the ORM on that route. A hand-written query through a thin driver has effectively no start-up cost. You do not need to rip it out everywhere - one hot route is enough.

    What you cannot fix is the 620ms of runtime init. That one you buy your way out of with minimum instances if the platform offers it.

    198
    Share
    Reply

    Answering anonymously — a moderator will review it first.

    Report
    • @two_vcpu_club · 3d ago

      The barrel file thing is real - one import of @/lib was dragging in the email client and a PDF renderer into an endpoint that returns JSON. Server chunk went from 4.1MB to 900KB.

      57
      Share
      Reply

      Answering anonymously — a moderator will review it first.

      Report
    • @adjunct_ora · 4d ago

      That is the usual number. Barrel files are fine in application code and quietly expensive on any boundary where the module graph gets loaded from scratch - which is exactly what a cold start is.

      66
      Share
      Reply

      Answering anonymously — a moderator will review it first.

      Report
  • @crimp_not_solder · 2d ago

    Before optimising, work out how many requests actually hit a cold instance. Add a module-scope const bootedAt = Date.now() and log Date.now() - bootedAt < 1000 as a boolean on every request. On our app the answer was 1.8% of requests, all of them internal health checks and a monitoring probe, and no human had experienced a cold start in a fortnight.

    If yours is 2% and none of them are your signup flow, you have a metric, not a problem. If it turns out the first person of the morning is always a customer, that is a different post.

    121
    Share
    Reply

    Answering anonymously — a moderator will review it first.

    Report
  • @schema_drift_lu · yesterday

    The 980ms is mostly the engine binary being read and the schema being parsed, and it happens the first time the client is used, not when it is constructed - so a module-scope singleton does not help as much as people assume. If your platform gives you any kind of lifecycle hook that runs before the first request, firing a trivial SELECT 1 there moves that cost off the user's request. Otherwise it is genuinely on the critical path of somebody's page load.

    87
    Share
    Reply

    Answering anonymously — a moderator will review it first.

    Report
  • @cast_iron_carl · 3d ago

    Sanity check the region while you are in there. Function in one continent, database in another, and the 410ms connect plus the 270ms query are mostly speed of light. We moved a database 4,000km and a p50 of 240ms became 38ms without a line of code changing.

    54
    Share
    Reply

    Answering anonymously — a moderator will review it first.

    Report
  • @printbed_gremlin · yesterday · 2 replies

    Switch the route to the edge runtime and the whole problem disappears - edge functions do not cold start in any meaningful sense, so you skip the 620ms of runtime init entirely.

    41
    Share
    Reply

    Answering anonymously — a moderator will review it first.

    Report
    • @duckweed_dev · 2d ago

      That trades one problem for a bigger one here. The edge runtime cannot load the ORM's engine or open a raw TCP socket, so "switch the runtime" means rewriting the data layer first. Worth doing eventually for some routes, not a config flag you flip on a route that talks to Postgres over a socket.

      32
      Share
      Reply

      Answering anonymously — a moderator will review it first.

      Report
  • @pivot_pilot · 4d ago

    270ms of "actual query work" for 40 indexed rows is also a bit much. There may be a second post in that number once you have finished with the first.

    16
    Share
    Reply

    Answering anonymously — a moderator will review it first.

    Report