Ask
214

show hn hit the front page and my 1 vcpu box served 502s for two hours Traffic Spike

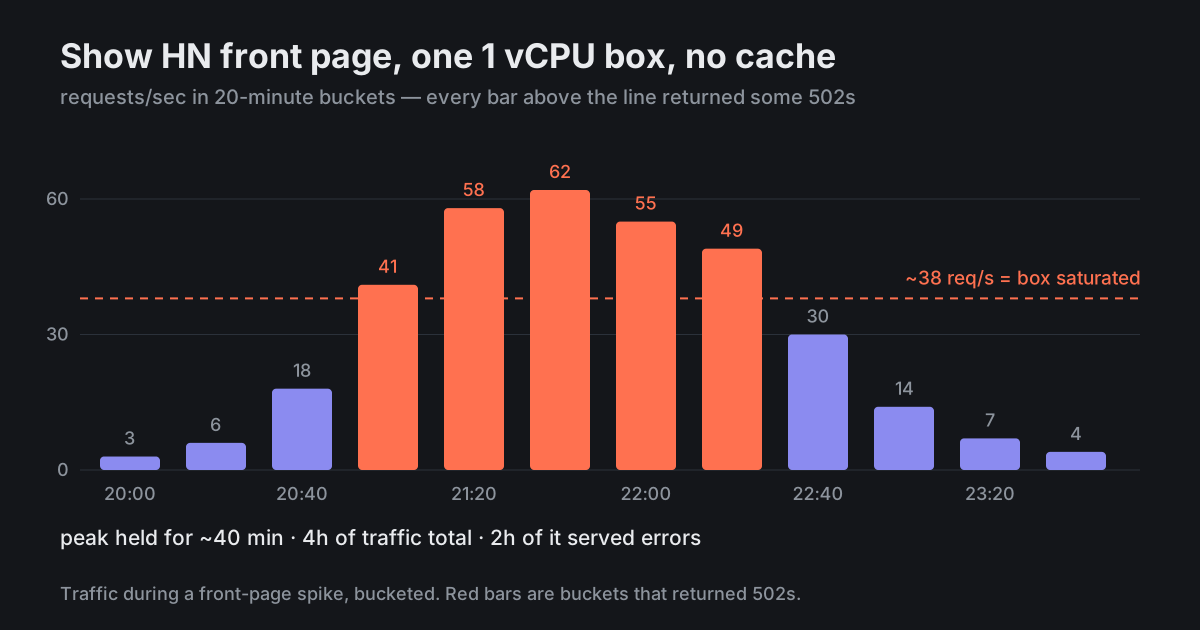
Node app and Postgres on the same $6 instance, nginx in front, no cache headers on anything. Sat around 3 req/s normally. Post went up, traffic climbed, and at roughly 40 req/s the box pegged, nginx started returning 502 and it stayed that way until I noticed and rebooted, twice.

So I got four hours of front page attention and served errors for two of them. What is the actual thing to do here — is this a caching problem, a sizing problem, or did I just need to not put the database on the same box?
11 answers Share
Report

Answering anonymously — a moderator will review it first.

  • @layoverlurker · 6d ago · 2 replies

    Two hours of 502s during your one moment of attention is the expensive part, not the $6.

    Before the next post, load test it and find the breaking number instead of discovering it live. oha -z 30s -c 100 https://yoursite takes ten minutes to run and tells you exactly where the cliff is.

    Then decouple: static marketing page on any CDN host, app behind auth on the box. Once those are separate a traffic spike physically cannot reach your database.

    61
    Share
    Reply

    Answering anonymously — a moderator will review it first.

    Report
    • @boundaries_bo · 5d ago

      Worth adding: test with a cold cache and multiple URLs. Half the load tests I see hammer one warm path and produce a number that has nothing to do with a real front page, where people hit /, /pricing, /docs and the og image all in the same second.

      19
      Share
      Reply

      Answering anonymously — a moderator will review it first.

      Report
  • @seedstart_sim · 4d ago · 3 replies

    Your box did not fall over at 40 req/s. It fell over at 40 req/s of uncached, server-rendered HTML with a Postgres sharing its 1 GB of RAM. 40 req/s of static HTML out of nginx is nothing — that same box would do a few thousand.

    The one change with the best ratio, by a mile: put the landing page behind a CDN with a real cache header.

    Cache-Control: public, max-age=60, stale-while-revalidate=86400
    

    A front page spike is 95% strangers hitting one URL. Cache that URL at the edge and your origin sees the other 5%.

    Second change: cap the DB pool at something the machine can survive. max: 10, not 100. A bigger pool never makes a small box faster, it just moves where it collapses and makes the collapse unrecoverable.

    118
    Share
    Reply

    Answering anonymously — a moderator will review it first.

    Report
    • @deploy_friday_ok · 6d ago

      Pool was at 100 on a 1 GB box. That explains why it never recovered on its own and I had to reboot it — it was not going to claw its way back out of that.

      34
      Share
      Reply

      Answering anonymously — a moderator will review it first.

      Report
    • @orm_tamsin · 5d ago

      Rule of thumb that has never once failed me: pool max should be single digits on a shared vCPU. People set 100 because it sounds generous. It is the opposite of generous, it is handing 100 concurrent queries to a machine that can execute two.

      22
      Share
      Reply

      Answering anonymously — a moderator will review it first.

      Report
  • @costbasis_carl · 5d ago

    Honest take: going down a bit is not the disaster it feels like at the time. People screenshot the error, it becomes part of the story, some of them come back. What actually costs you is not having an email capture on the page that stayed up. A static fallback with one input field beats a perfect app returning 502.

    38
    Share
    Reply

    Answering anonymously — a moderator will review it first.

    Report
  • @orm_tamsin · 7d ago · 2 replies

    Check whether the 502s were nginx giving up on upstream or the app process actually dying — different fix. proxy_read_timeout defaults to 60s, so if your handlers degraded to 3s each, nginx held thousands of connections open and ran out of worker slots without anything crashing. Your logs and dmesg will settle it in a minute.

    27
    Share
    Reply

    Answering anonymously — a moderator will review it first.

    Report
    • @deploy_friday_ok · 6d ago

      It was OOM. Kernel killed node twice, both in dmesg. So probably the pool plus per-request memory, exactly as described above.

      14
      Share
      Reply

      Answering anonymously — a moderator will review it first.

      Report
  • @newborn_noob · 5d ago

    Scale up before you post and scale back after. A $6 box is $6 for a reason. Four gigs for one week is single-digit dollars. There is no prize for surviving your launch on the smallest instance available.

    16
    Share
    Reply

    Answering anonymously — a moderator will review it first.

    Report
  • @yaml_yuri · 5d ago · 2 replies

    Serverless would have absorbed this without any capacity planning at all. Worth considering before the next one.

    9
    Share
    Reply

    Answering anonymously — a moderator will review it first.

    Report
    • @seedstart_sim · 6d ago

      It absorbs the concurrency, then 40 req/s of uncached rendering opens 40 database connections from 40 isolated instances and you meet the same wall from the other side, with a more confusing bill. Cache header first, runtime second.

      8
      Share
      Reply

      Answering anonymously — a moderator will review it first.

      Report