Ask
88
@sdcard_sid ·

alt-tabbing back fires 63 xhr requests on tanstack query v5, where do i look TanStack Query

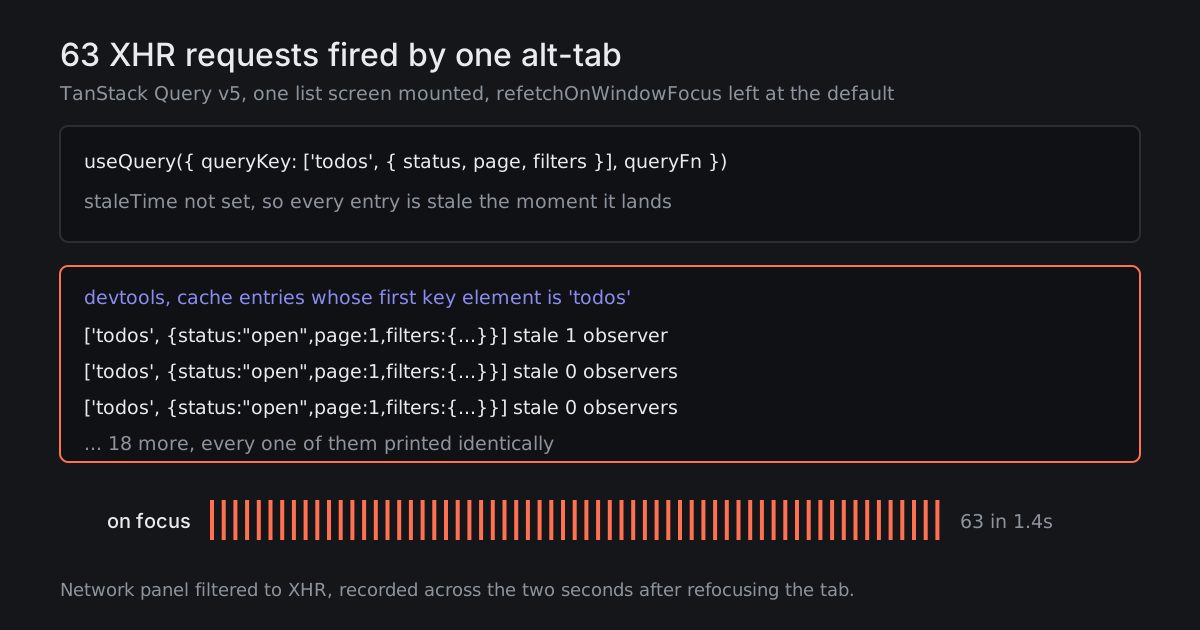
Dashboard, TanStack Query v5.62, six panels mounted at once in a tab layout. Every time I switch to another window and come back, the network panel shows 63 XHR requests inside about 1.4 seconds. A good chunk of them are the same endpoint with the same querystring.

Devtools shows 21 cache entries whose first key element is 'todos', and they all print identically in the list, which is the part I do not understand - if they print the same, why are they separate entries?

Key and cache listing attached. Setting refetchOnWindowFocus: false globally makes the burst disappear, but that feels like taping over the warning light.
10 answers Share
Report

Answering anonymously — a moderator will review it first.

  • @torque_spec · 3h ago · 2 replies

    For the 21 entries, stop reading the devtools list - it truncates nested objects, so filters:{...} will look identical for keys that are nothing alike. Dump the hashes instead:

    queryClient.getQueryCache().getAll()
      .filter(q => q.queryKey[0] === 'todos')
      .forEach(q => console.log(q.queryHash))
    

    Diff two of those strings and the culprit falls out immediately. Nine times out of ten it is a Date somewhere in the filter object being rebuilt on render, because it serialises down to the millisecond.

    54
    Share
    Reply

    Answering anonymously — a moderator will review it first.

    Report
    • @sdcard_sid · 3h ago

      It is exactly that. updatedAfter: subDays(new Date(), 7).toISOString() sitting in the filters object, so every parent render produced a key that differed in the milliseconds field. Rounded it to the day and the entry count went from 21 to 3.

      30
      Share
      Reply

      Answering anonymously — a moderator will review it first.

      Report
  • @mulch_marta · 3h ago · 3 replies

    Two separate things are happening and you are treating them as one.

    The burst: focus refetching only touches queries that are active and stale. Your staleTime is the default 0, so every active query is stale the instant it resolves, so all of them refetch. Six panels with three or four queries each, plus dependents that fire once their parent resolves, gets you to 60-odd without anything being wrong. Set a real staleTime and most of it evaporates:

    defaultOptions: { queries: { staleTime: 30_000, gcTime: 5 * 60_000 } }
    

    A dashboard where data one refresh old is unacceptable is a dashboard that wants a socket, not polling on focus.

    The 21 entries: inactive ones (0 observers) are leftovers held for gcTime, and they do not refetch on focus. They are not sending requests. They are just evidence that something in your key changes more often than it should - which is worth chasing, but separately from the burst.

    71
    Share
    Reply

    Answering anonymously — a moderator will review it first.

    Report
    • @mulch_marta · 3h ago

      Yes, set the global default high and override per query. staleTime: 0 on the two that matter, or refetchOnWindowFocus: 'always' if you want them to refetch even when fresh. The default is the wrong place to be aggressive because it applies to the 25 queries you were not thinking about.

      33
      Share
      Reply

      Answering anonymously — a moderator will review it first.

      Report
    • @sdcard_sid · 3h ago

      30s staleTime on a dashboard makes me nervous - is there a way to keep focus refetch for the two panels that genuinely need it?

      24
      Share
      Reply

      Answering anonymously — a moderator will review it first.

      Report
  • @clickertrainbee · 3h ago

    The other half of this is that six panels are mounted when only one is visible. A tab layout that renders all tabs and hides them with CSS keeps every query in those tabs active forever - subscribed, stale, and refetching on focus for content nobody is looking at. Unmount the hidden ones. Query keeps the data around for gcTime so switching back is instant anyway, and your focus burst drops by whatever fraction of the panels are offscreen.

    38
    Share
    Reply

    Answering anonymously — a moderator will review it first.

    Report
  • @bobbin_bind · 3h ago · 2 replies

    The inline object in your key is the bug. ['todos', { status, page, filters }] builds a brand new object on every render, so the key is a new reference each time and Query treats it as a new entry. Wrap it in useMemo and the 21 entries collapse to one.

    36
    Share
    Reply

    Answering anonymously — a moderator will review it first.

    Report
    • @mulch_marta · 3h ago

      Not quite - query keys are compared by a deterministic hash, not by reference. hashKey stringifies with sorted object keys, so a fresh literal with the same contents produces the same hash and the same cache entry. Memoising the object changes nothing here. The reason there are 21 entries is that the contents genuinely differ, which is why the hash dump above is the right diagnostic.

      27
      Share
      Reply

      Answering anonymously — a moderator will review it first.

      Report
  • @sam_the_temp · 3h ago

    Minor, but check whether some of the 63 are OPTIONS preflights. If your dashboard is on a different origin from the API and you send a custom header, every request comes in pairs and your real request count is 32. Filter by method before you trust the number you are chasing.

    20
    Share
    Reply

    Answering anonymously — a moderator will review it first.

    Report
  • @pivot_pilot · 7h ago

    refetchOnWindowFocus: false is the catch (e) {} of data fetching. It works, right up until the day you need to know why the page is showing yesterday.

    12
    Share
    Reply

    Answering anonymously — a moderator will review it first.

    Report